Dashboard
Dashboards are views for visualizing the statuses of a chosen assets.
Dashboards consist of a set of chosen widgets. Widgets can display text, maps, images, several kind of charts and other graphical representations of data.
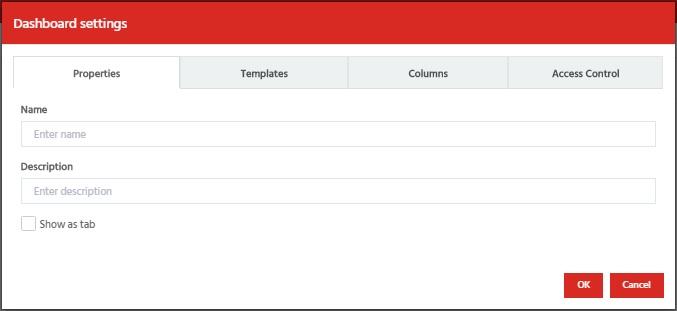
To add a new dashboard, choose “Dashboard” tab and then select “New dashboard…” under “Actions”-dropdown menu. The following dialog will open:

In “Properties” tab you can give a name and description for dashboard.
In “Templates” tab you can choose which asset templates will use this dashboard.
In “Columns” tab you can select a basic layout for a dashboard by defining dashboard columns.
To add a new dashboard, choose “Dashboard” tab and then select “New dashboard…” under “Actions”-dropdown menu. The following dialog will open:
To add a new dashboard, choose “Dashboard” tab and then select “New dashboard…” under “Actions”-dropdown menu. The following dialog will open:
To add a new dashboard, choose “Dashboard” tab and then select “New dashboard…” under “Actions”-dropdown menu. The following dialog will open:
To add a new dashboard, choose “Dashboard” tab and then select “New dashboard…” under “Actions”-dropdown menu. The following dialog will open:
Widgets
Each widget type is defined more precisely in its own chapter.
Common properties for all widgets are “Title”, “Type” and “height in pixels (0=auto)”.
Other settings can vary depending on widget type.
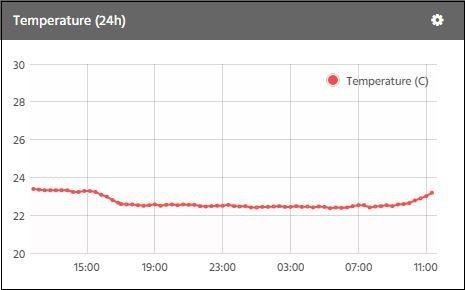
In “Line chart”-widget you can select signals which are shown in chart.
You can also define:
- showed time period
- aggregation type
- axis min/max values
- select to show possible warning/alarm limits

To add a new dashboard, choose “Dashboard” tab and then select “New dashboard…” under “Actions”-dropdown menu. The following dialog will open:
To add a new dashboard, choose “Dashboard” tab and then select “New dashboard…” under “Actions”-dropdown menu. The following dialog will open:
To add a new dashboard, choose “Dashboard” tab and then select “New dashboard…” under “Actions”-dropdown menu. The following dialog will open:
To add a new dashboard, choose “Dashboard” tab and then select “New dashboard…” under “Actions”-dropdown menu. The following dialog will open:
